
Electric vehicles continue to gain popularity as automakers reduce barriers to purchasing. Manufacturers are seeking solutions to increase range, offer lower price points, and expand the availability of charging infrastructures. These barriers are just some of the reasons consumers are slow to adopt and why OEMs are getting more serious about predicting energy savings.
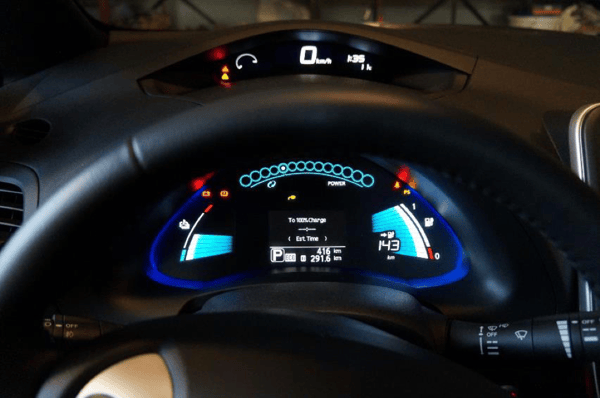
In regards to increasing range, engineers designing EVs have to be particularly frugal about the amount of energy they allocate for EV cabin comfort. Unlike traditional combustion engines, electric vehicles do not produce waste heat that can be used to warm the passenger compartment. Energy from the power source must be used to heat or cool the cabin.
Optimize Your Design
Simulation methods can help optimize design selections and support engineers in making the best choices for the overall objective. One of our skilled engineers, Lauren, broached the challenge of designing an electric vehicle cabin for occupant comfort and predicting energy savings. In doing so, she employed our flagship Therm software, TAITherm, our coupling automation software, CoTherm, and the Human Thermal Extension to determine advanced thermal comfort simulation metrics.
[Note: The data taken from this process can then be used to inform models using the Battery Extension to see how energy savings can affect range.]
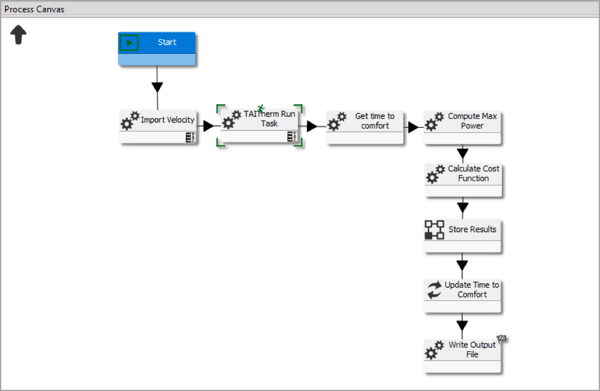
Using the same constraints that OEMs are designing for (such as time-to-comfort), Lauren used this data to create a simulation process that narrowed down design choices. This method uses CoTherm to drive a process engaging multiple TAITherm models that also house Human Thermal Extension data. Each TAITherm model showcases a different amount of power applied to the various heating and cooling strategies to determine the most efficient solution to meet the constraints of time-to-comfort.
The Optimization feature in CoTherm was also a vital part of this process, providing a valuable method for predicting the performance of a complex system without the need for testing physical prototypes. This feature determines optimization in CoTherm by changing multiple variables based on the desired output or cost function.
The CoTherm process requires the following inputs: variables with bounds, a cost function, an optimization method, and a stopping criterion. The cost function is the factor that tells the optimizer how satisfactory the tested solution is. The optimizer will always look to minimize the cost function. The stopping criteria will alert the solution when it is finished; this can be based on the number of iterations, a tolerance, or other options based on the method.
After Lauren specified the inputs, the optimization ran hands-free. Here's how it went─ First, the boundary conditions were imported into the thermal simulation model and the model was run. Then the comfort file was read from the thermal model, and time-to-comfort was calculated. Finally, the cost function was computed and passed to the optimizer using information from both of the previous calculations. The rest of the steps took care of storing results and writing an output file that could be used for post-processing. The outcome of the process was the optimal variables based on the minimum cost function.
One of the defining features of this process is the integration of the Human Thermal Extension. The Human Thermal Extension solves for the physiology-based variables of the equation while TAITherm solves for environmental, convection, conduction, and radiation thermal effects. Using the comfort and sensation data from the Human Thermal Extension, engineers using this process are able to determine if their design will be effective for their customers.
The Human Thermal Extension collects both sensation and comfort data. Sensation describes how hot or how cold something is perceived to feel while comfort describes whether the sensation makes the occupant feel good or bad. For this study, Lauren focused on comfort, since it gives information about whether or not the sensation feels good or bad to the person in the car.
The Model
Lauren defined five different heated surfaces in the model, including heated seats, steering wheel, and two radiant panels on the roof and near the feet. She applied power to these areas, in addition to the HVAC system, to seek the most efficient way to make the occupant comfortable in three minutes.
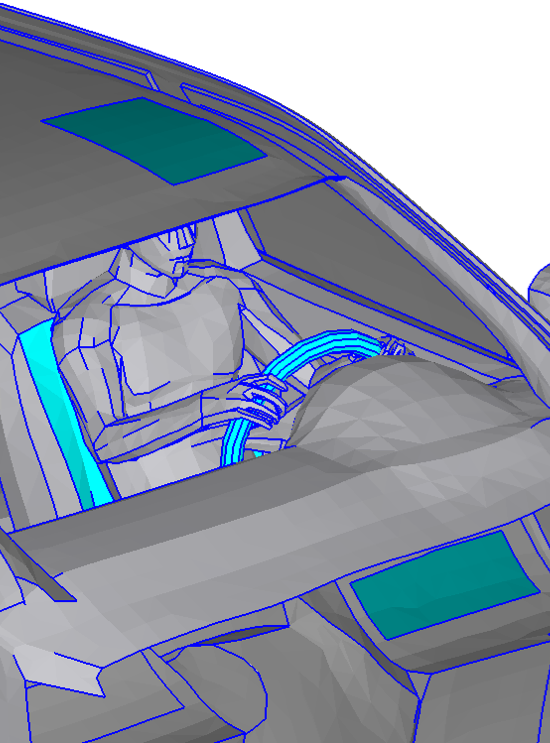
Her material properties were set for a typical cabin set-up. She employed thermal links to define the contact between the human, seat, and steering wheel. For the environment, Lauren chose solar coordinates from Copenhagen, Denmark, where the air temperature was fixed at -10 C.
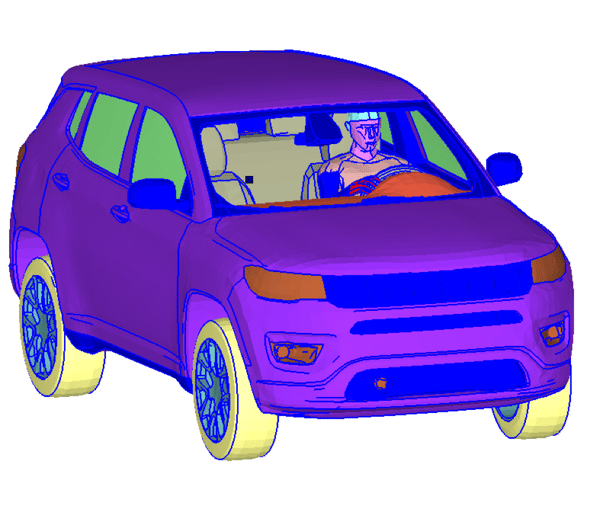
Lauren defined the human model as a 50th percentile human with an activity level of – 1.2 met in a sitting position. She applied clothing materials, including pants, a long sleeve shirt, a Thermo jacket, a light hat, gloves, and shoes.
She simulated three different cases for optimization: heated surfaces, HVAC floor mode, and HVAC panel mode (including chest-level vents).
The Results
The Human Thermal Extension (using the Berkeley Comfort Model) gives information to the cost function based on when the time to comfort occurred relative to the target. Lauren chose three minutes as the target time-to-comfort, allowing for a 30-second variation on either side of that target. Anywhere outside of 2:30 and 3:30, the results are penalized. Outside of these bounds 20,000 W is added to the yellow zone, 30,000 W is added to the orange zone and in the red zone the cost function is set to 50,000 W. This gives the optimizer more information about what options are good and which are sub-par.

The y-axis is the total power of the heated surfaces and HVAC system, plus its penalty. The x-axis is the number of iterations. You can see three bands of results, those with a high-penalty, a moderate penalty, and under 10,000 are valid results.
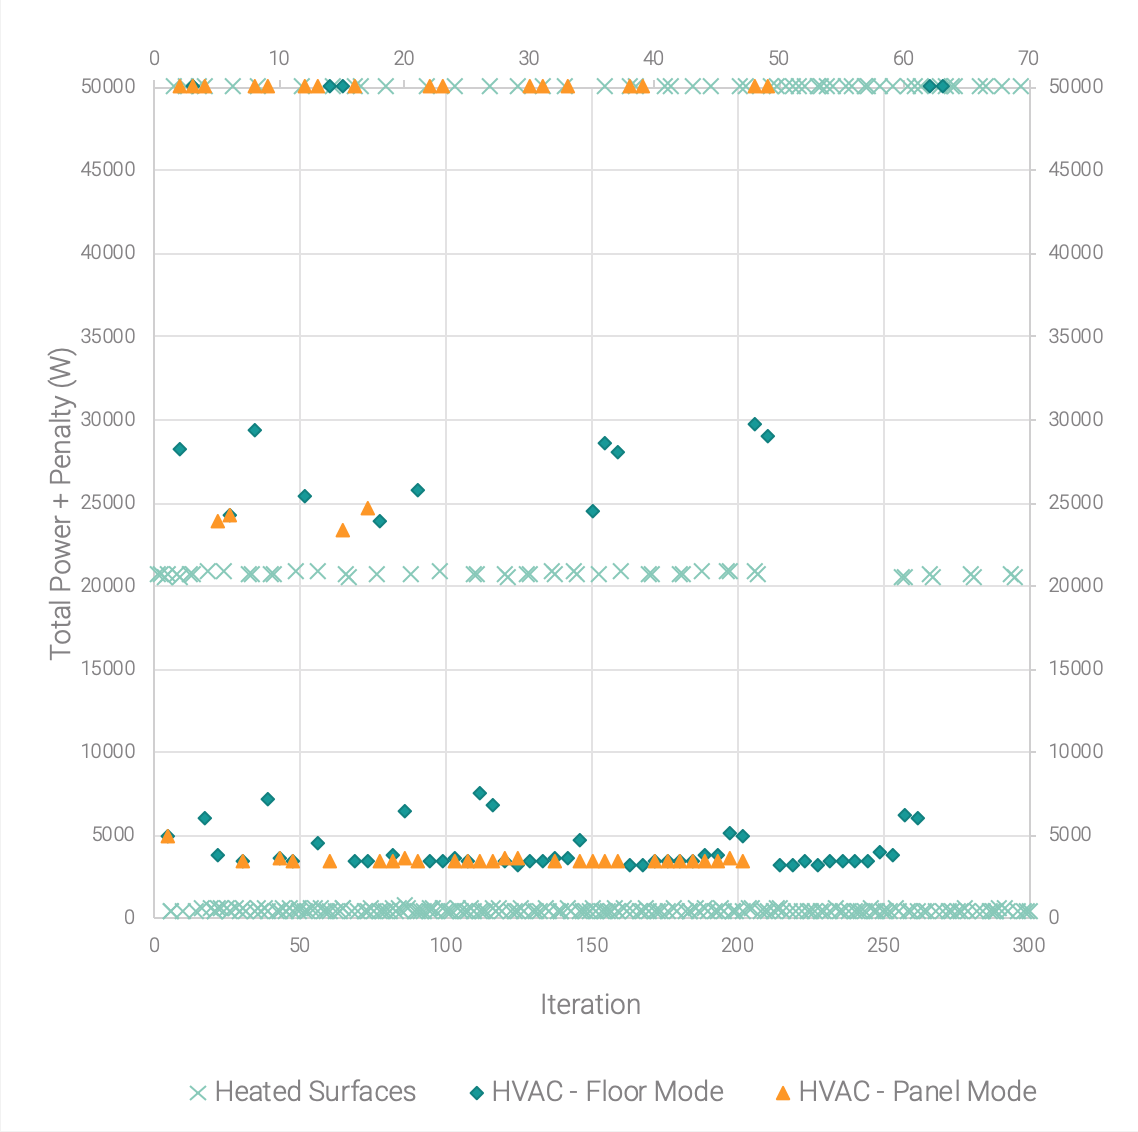
Complete results from the test run.
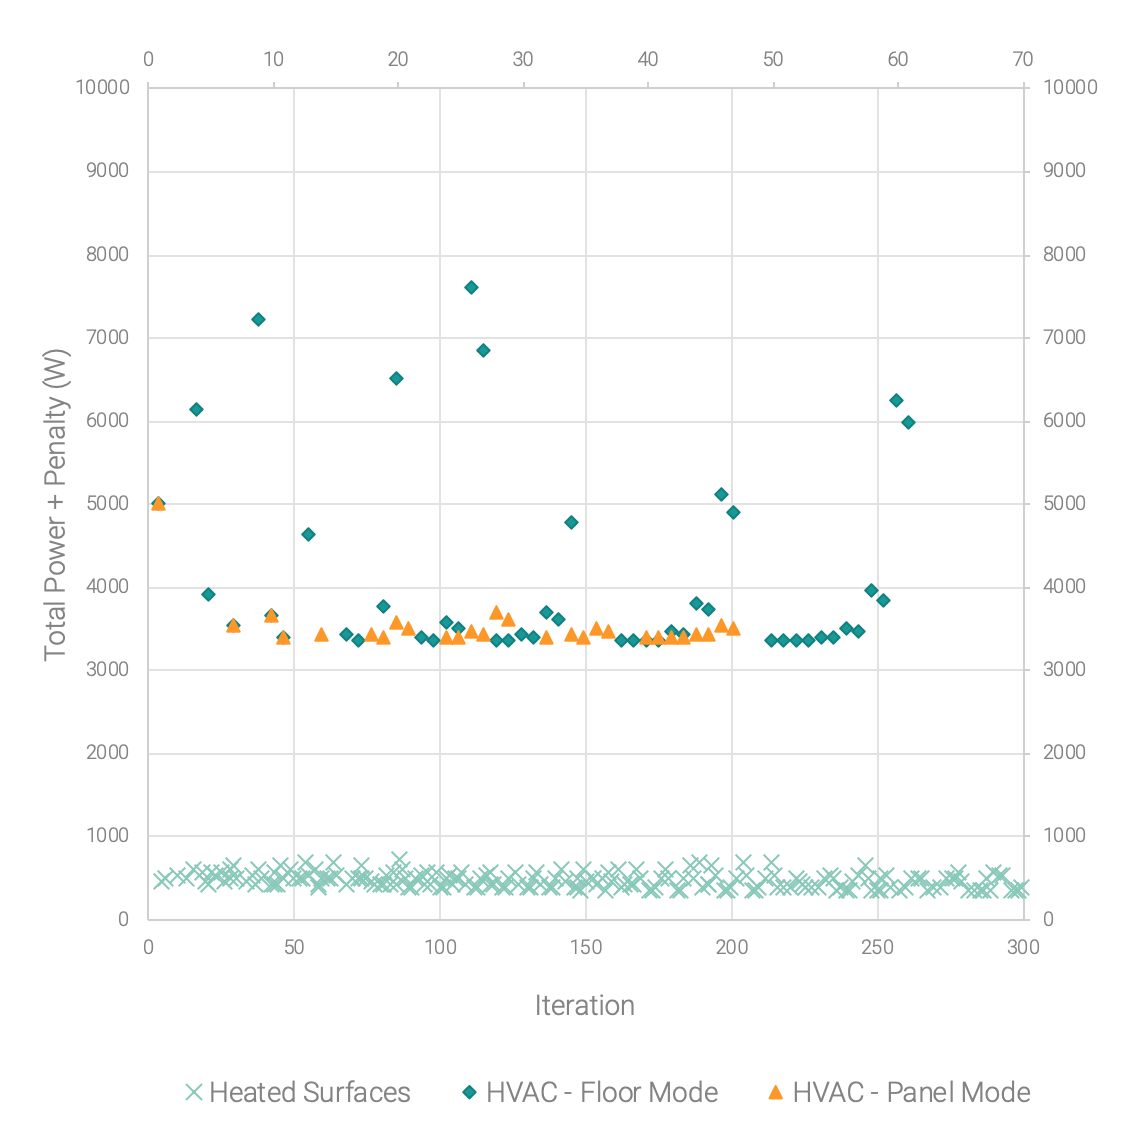
Refined view of valid results.
For this thermal comfort simulation, Lauren chose to run the cases separately to see their impact better. These cases could also be run together for optimization. Certain modeling assumptions, such as air velocity, can impact overall results.
To take the results even further, Lauren investigated which amount of power applied to certain surfaces resulted in comfort for the occupant and the best efficiency for the vehicle. The best iteration favored a higher percentage of energy on the radiant console panel.
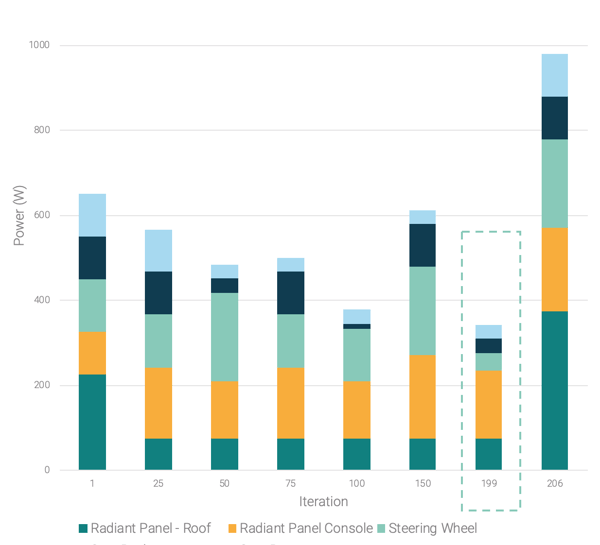
The overall comfort of the occupant is also better maintained using heated surfaces.
For this simulation, Lauren chose to run the cases separately to see their impact better. These cases could also be run together for optimization. Certain modeling assumptions, such as air velocity, can impact overall results.
With this simulation method, Lauren could try out various choices and find the optimal solution, all relatively hands-free. This method will allow engineers to save precious time and resources in development by front-loading these critical decisions. Even with tight deadlines and strict budgets, engineers can create solutions to eliminate the barriers to consumers choosing an electric vehicle.
If you want to learn more about using TAITherm to determine advanced thermal comfort simulation metrics, please feel free to request a live demo of our software.

Visit our website at suppport.thermoanalytics.com for
- FAQs
- Webinars
- Tutorials
Get help from our technical support team:
