
Energy production, storage, and consumption are becoming increasingly critical to the design of vehicles, especially now that major vehicle manufacturers are converting a significant percentage of their models to electric (EV) and hybrid-electric vehicles. Although electric vehicles represent one of the best promising technologies for green and sustainable transportation systems, the grid provides the electricity required to charge an EV battery. Electric vehicles can also be charged through photovoltaic (PV) cells directly integrated into the vehicle body; this is called vehicle-integrated PVs (VIPVs).Photovoltaics offer an additional source of energy to increase vehicle range, reduce time spent at charging stations, and offset the auxiliary loads on the battery pack. However, using conventional silicon solar cells, which dominate the commercial PV market, for EVs has limitations due to limited flexibility, visibility requirements for windows, weight, and poor aesthetics. These limitations could be addressed by transparent photovoltaic (TPV) films, which selectively absorb ultraviolet and near-infrared light and allow high transmittance of visible light.
Simulation is a crucial step in designing new VIPV systems and estimating their potential energy production. PV performance can be strongly dependent on temperature; therefore, a coupled thermal-electrical approach is needed to evaluate the electricity production of VIPVs. In this work, we couple our heat transfer software (TAITherm) with electrical PV models. We use this coupled modeling approach to compare the potential energy production of VIPV systems made of conventional silicon solar cells and TPV films in five U.S. cities.
Methodology: Coupled Thermal-Electrical Modeling Approach
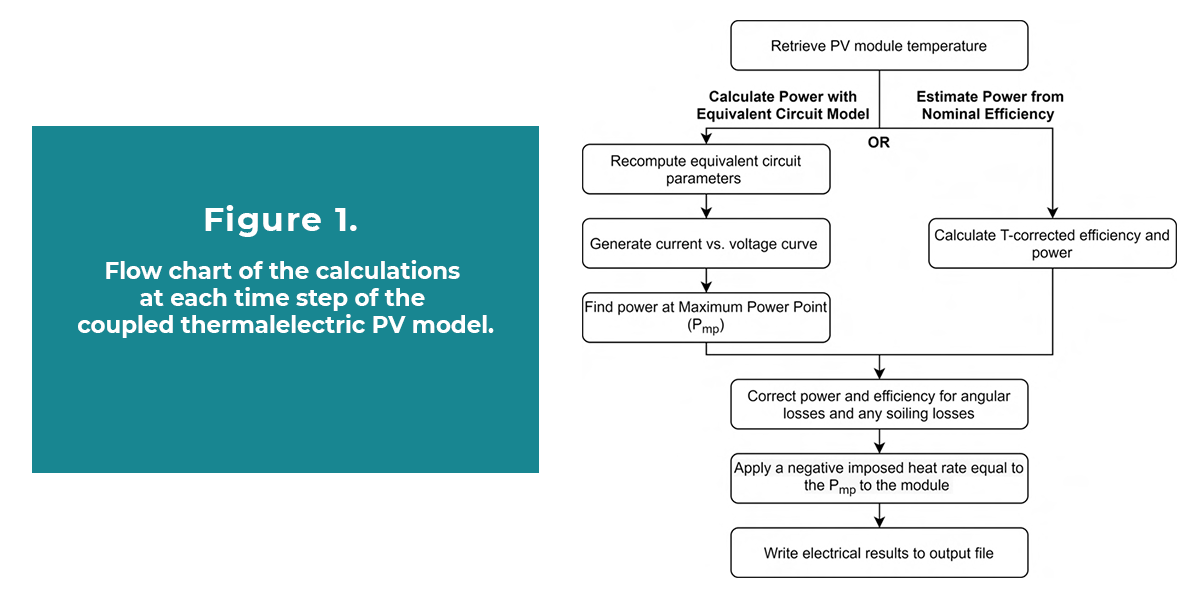
The coupled thermal-electrical PV modeling approach is developed using ThermoAnalytics’ commercial heat transfer software TAITherm, which uses a numerical, finite volume method based on first principles physics to solve for heat transfer due to conduction, convection, and radiation. The thermal portion of the modeling involves creating the system geometry and specifying the material properties. The electrical calculations are implemented in Python and coupled with the thermal model through a TAITherm User Routine. User Routines allow the user to interact with the heat transfer solver through an Application Programming Interface (API) to enforce custom boundary conditions or implement custom calculations. The PV electrical calculations User Routine consists of the steps shown in Fig. 1, which are repeated at the end of each time-step of the thermal simulation.
Vehicle-Integrated Photovoltaics Model Setup
For this study, we model several VIPV systems installed on a Jeep Grand Cherokee: a conventional monocrystalline silicon rooftop module, TPV films used for windows only, and TPV films covering the vehicle’s entire external surface area. We use an equivalent circuit model to simulate the electrical behavior of the Si rooftop system. The energy production potential of future vehicle-integrated TPVs is modeled using an estimated realistically achievable efficiency of 15% [1].

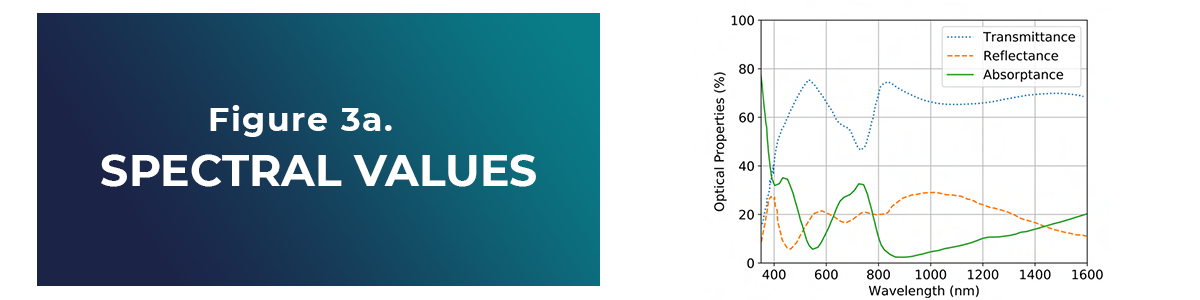
To accurately model the effect of integrating TPVs into the vehicle’s windows on the cabin temperature, measured values of TPV spectral transmittance and reflectance (Fig. 3a) are specified for the TPV material properties in TAITherm, which uses this information to calculate the transmission and reflection of light through transparent materials.
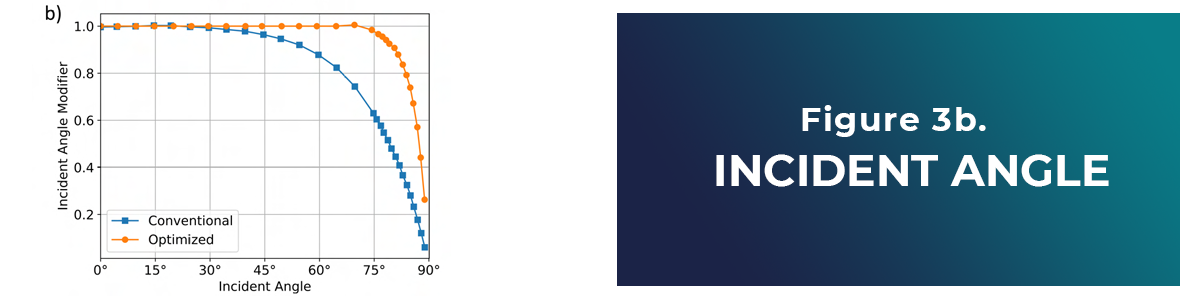
Angular effects on the conventional Si system are estimated using an empirical model. The angular effects for TPVs are considered by specifying measured angular dependence curves for direct irradiance (Fig.3b) from a previous study done at Michigan State University [2].
The vehicle is assumed to be outside on asphalt (infrared emissivity of 0.94 and solar absorptivity of 0.85) in an unshaded area. To simulate the climatic conditions of different locations, we use typical meteorological year (TMY3) weather data from the National Solar Radiation Database (NSRDB). The TMY3 data is used with TAITherm’s Natural Environment feature, which allows applying weather data as boundary conditions to the simulation as well as modeling the sun’s position based on the date, time, and geographic location. Our modeling approach was found to be computationally efficient with the coupled thermal-electrical solution for the 5572 element TAITherm model of the Jeep with VIPVs converging in under one second per time-step (on a Linux machine with a 3.7 GHz Intel i7-8700K CPU).
Results and Discussion
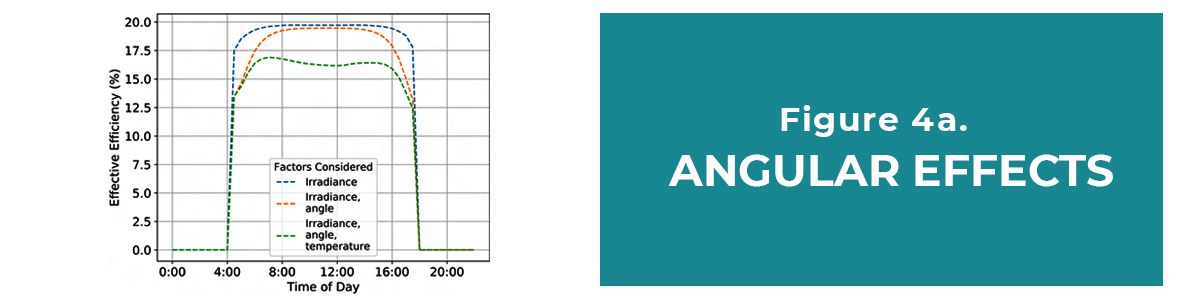
We first simulate the Jeep with a conventional Si rooftop panel for one day in Phoenix, Arizona, and compare the results when different factors affecting PV performance are included in the model: irradiance-only, irradiance with angular dependency, and irradiance with both angular and temperature dependency. Fig. 4 shows that angular effects are predicted to have the most impact near sunrise and sunset when the AOIs are most oblique, while temperature effects are strongest in the middle of the day, which corresponds to the highest ambient temperatures and solar radiation. The total energy production over an 8-hour period (9 am to 5 pm) with and without angular and temperature corrections is predicted to be 3.8 kWh versus 4.4 kWh, showing that if these corrections are not applied, the power production would be overestimated by 16%.
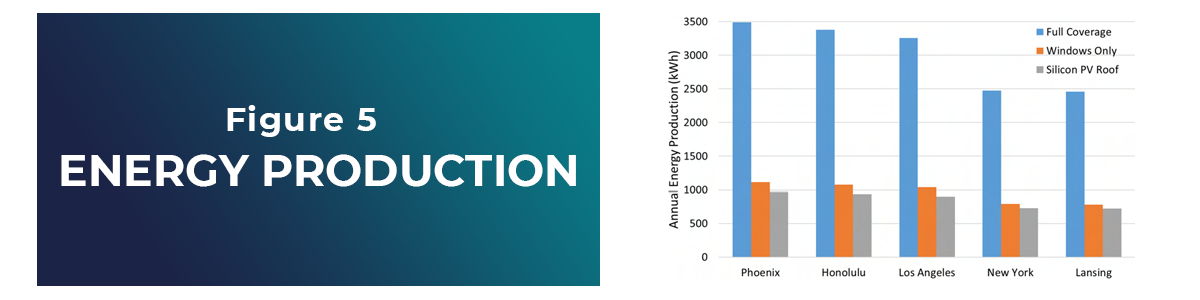
Assuming an EV energy efficiency of 26 kWh/100 miles, such a PV system could give an additional 15 miles of range after the car is parked for 8 hours in the sun. This could be enough to use the EV for short-distance commuting without ever having to plug it into a charging station. Next, we run year-long simulations (with 30-minute time-steps) of the Jeep with the different VIPV systems under realistic weather conditions of five U.S. cities: Phoenix, Arizona; Honolulu, Hawaii; Los Angeles, California; New York, New York; and Lansing, Michigan. Fig. 5 compares the total yearly energy production results from the simulations.
In locations with less solar irradiance, such as New York or Lansing, the energy production is expected to be about 30% lower than in Phoenix. Rerunning the model of the Jeep with complete coverage of TPVs with an improved AOI dependence (the optimized curve from Fig. 3b) results in an approximately 10% increase in predicted annual energy production. This demonstrates the need to include an AOI correction in PV modeling and also provides motivation to develop PV devices with optimized angular dependence. The simulations also predict that TPVs that cover the entire vehicle’s surface will have an additional benefit of causing a reduction of cabin air temperature by 1-2 °C, which would reduce cabin cooling costs during the warm seasons.
Conclusion:
This work demonstrates how TAITherm can be used to model VIPV systems and the importance of considering thermal and angular losses when estimating their electricity production. The simulation results predict that a VIPV system that uses TPVs integrated into all exterior vehicle surfaces will produce significantly more energy than a VIPV system that uses conventional Si rooftop modules. VIPVs are incredibly well suited for EVs due to the high energy efficiency of EVs when compared to gasoline vehicles. Our modeling can be improved by considering the influence of ambient temperatures, the use of cabin climate control systems (i.e., HVAC), and driving conditions on the EV driving range. In future work, the PV thermal-electrical model will be combined with EV battery, motor, HVAC, and drive cycle models for more detailed analysis.
For more information on this study, please see our publication referenced below:
T. Golubev, R.R. Lunt, ”Evaluating the Electricity Production of Electric Vehicle-Integrated Photovoltaics via a Coupled Modeling Approach” in 2021 48th Int. Photovoltaics Specialists Conference, IEEE, 2021. https://ieeexplore.ieee.org/document/9518941
References
[1] R. R. Lunt, ”Theoretical limits for visibly transparent photovoltaics,” Appl. Phys. Lett., vol. 101, no. 4, 2012.
[2] A. Anctil, E. Lee, and R. R. Lunt, ”Net energy and cost-benefit of transparent organic solar cells in building-integrated applications,” Appl. Energy, vol. 261, 2020.
If you want to learn more about using TAITherm to maximize your coupled modeling, please feel free to request a live demo of our software.

Visit our website at suppport.thermoanalytics.com for
- FAQs
- Webinars
- Tutorials
Get help from our technical support team:
